Interactive map shows where traffic deaths are occurring
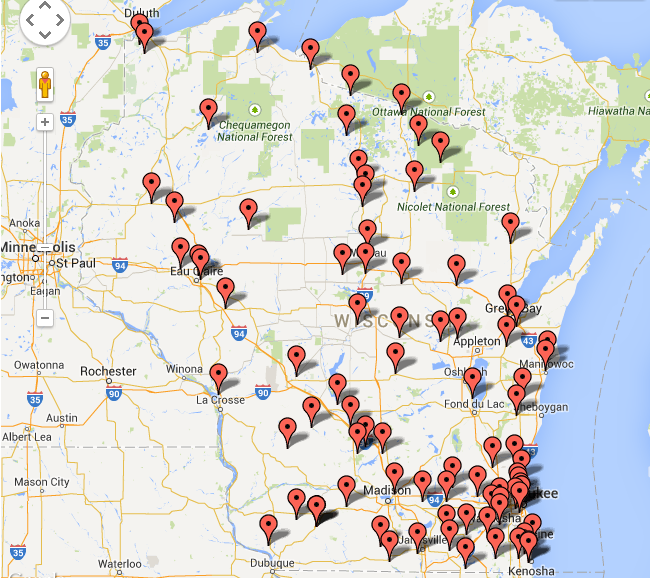
An interactive map created by the UW’s Traffic Operations and Safety Lab, Channel3000.com and the Wisconsin Department of Transportation is filtered to plot the locations of the state’s alcohol-related fatal traffic accidents in 2013.
The public generally hears about fatal traffic accidents one at a time by way of seeing an occasional news item or a grisly crash site on the side of the road. But thanks to a collaboration among a University of Wisconsin–Madison transportation lab, state agencies and a local Madison media outlet, Wisconsin residents can now see the full picture of traffic fatalities statewide.
UW–Madison’s Traffic Operations and Safety Lab (TOPS) has partnered with Madison news website Channel3000.com and the Wisconsin Department of Transportation to create an interactive map that plots the locations of fatal traffic accidents in Wisconsin dating back to 2001. The map draws on data gathered from state agencies and all 72 Wisconsin counties. Users can filter by year and six different types of incidents, including alcohol, bikes, pedestrians, speed, construction zones, and motorcycles.
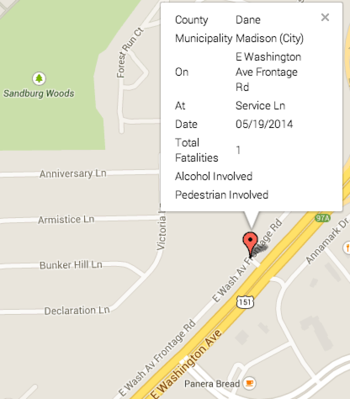
Map data include the locations, dates, number of fatalities and causes of accidents.
The map is avaialable at the Channel3000 website. Fatalities are entered within a few days of when they happen; the accident type is filled in later, as more data become available.
Though this information wasn’t previously inaccessible to the public, TOPS researchers saw a need to improve access for a broader audience. “There really traditionally has not been a good way to do this. Traffic safety commissions often have large posters with thumbtacks,” says TOPS program manager Steven Parker. “We get requests almost every day from the public for crash data, and folks use it in a variety of ways. This is a way that people can look at where these crashes are happening.”
TOPS Director David Noyce, a professor of civil and environmental engineering, says the project also reflects a shift in attitude among state officials and traffic researchers. “We used to be quite guarded about how safety data got out and when it got out, and now we’ve gone through a complete 180 about being completely forthright and open,” Noyce says.
“Traffic engineering and law enforcement certainly play an important role, but our system of government depends on an informed and engaged public.”
Steven Parker
TOPS researchers say that while officials once saw data as a risk for sparking public outcry, such as data about particularly crash-prone intersections, they now view information as an opportunity to raise awareness of dangerous behaviors and get the public engaged in efforts to improve traffic safety. For example, filtering the map for alcohol-related accidents in 2013 yields dozens of markers — each of which represents at least one fatality.
“Traffic engineering and law enforcement certainly play an important role, but our system of government depends on an informed and engaged public,” Parker says.
-
Interwoven
How Indigenous knowledge and science can work together to communicate about climate.
-
UW–Madison’s reach throughout Wisconsin adds up to $38.9 billion a year
The university supports more than 287,000 jobs and helps drive private-sector growth.
-
‘Being part of something bigger than you’ with Badger Volunteers
UW–Madison students head into the local community to find purpose and make a difference.
-
UW–Madison’s Tech Exploration Lab: Where the classroom meets the real world
The lab is built around a simple expectation: Students come to build, test and refine projects with real problems in mind.