Cartography Lab partners with state on economic impact map
Students at the University of Wisconsin–Madison have played a crucial role in developing an online interactive map that shows the economic impact of investments in counties and legislative districts throughout the state.
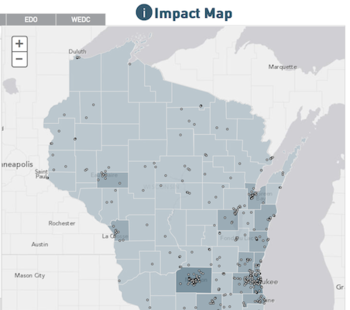
A section of the new economic impact map developed by WEDC in collaboration with UW–Madison, the State Cartographer’s Office and UW-Whitewater.
UW-Madison’s Cartography Lab; the State Cartographer’s Office, which operates at the university; and UW-Whitewater’s Pangea Studios collaborated to create the map, which allows users to see the number of grants and funding awarded throughout the state by the Wisconsin Economic Development Corporation (WEDC).
The map provides WEDC’s investment by county and by legislative district, and allows users to search by program type, such as by tax credit or loan. It also provides data on the projected costs and the number of jobs the grants will create.
“What was unique about this project was the collaborative effort between Whitewater and the two labs in Madison,” Howard Veregin, state cartographer, says. “It was really three different map-related offices with slightly different missions.”
UW-Madison students helped “create and shape the feel of the map and how it interacts with the user” by creating menus and deciding on map behaviors including zooming and panning, he says, adding that the map project provided a unique opportunity to showcase how geospatial technology can be used to promote economic development programs.
Tanya Buckingham, Cartography Lab assistant director, says the lab served as a consultant on the project, and that student staff provided quality control and advice on the map’s design to create a tool that the public could easily access and use.
“We put those ideas into a framework for the map,” Buckingham says. “From that point, we created this wire frame — basically that these are the tools that we see as necessary, this is where the map will go. It was an image that looks remarkably close to what the final map looks like.”
Eric Compas, a UW-Whitewater geography and geology associate professor, and director of Pangea Studios, says UW-Whitewater students did the initial design of the map, analyzing the data that WEDC provided and completing its coding. Student work completed how the map functions.
Compas adds that the UW’s Cartography Lab and the State Cartographer’s Office — given the depth of their experience — played a key role in giving feedback on the preliminary map and honing the design.
The project reflects higher education’s shifting roles, Compas says. Having the students do much of the work that professionals often do — such as meeting with clients via web conferences — provided a unique experience and solid preparation for real-world situations.
Tom Thieding, WEDC communications manager, describes the map as “the first big step in being very transparent,” allowing the public to see WEDC investments. As the public views the map and requests additional information, WEDC will modify its features.
“It’s going to be a pretty powerful tool, something that the state has never had, mainly from the standpoint of being able to visually see where all the investments have taken place since WEDC was formed,” Thieding says.
–Sean Kirkby, skirkby@wisc.edu
Subscribe to Wisconsin Ideas
Want more stories of the Wisconsin Idea in action? Sign-up for our monthly e-newsletter highlighting how Badgers are taking their education and research beyond the boundaries of the classroom to improve lives.
-
Interwoven
How Indigenous knowledge and science can work together to communicate about climate.
-
UW–Madison’s reach throughout Wisconsin adds up to $38.9 billion a year
The university supports more than 287,000 jobs and helps drive private-sector growth.
-
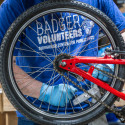
‘Being part of something bigger than you’ with Badger Volunteers
UW–Madison students head into the local community to find purpose and make a difference.
-
UW–Madison’s Tech Exploration Lab: Where the classroom meets the real world
The lab is built around a simple expectation: Students come to build, test and refine projects with real problems in mind.