Satellite technology enables rapid, accurate mapping of forest harvest in upper Midwest
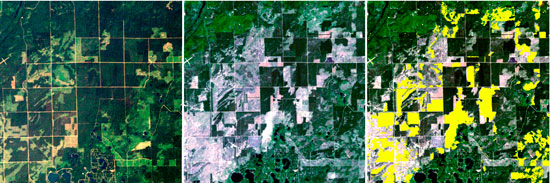
Mutlu Ozdogan, assistant professor of forest and wildlife ecology at the UW–Madison, processes images from the Landsat satellite to reveal changes in forest composition over time. Pictured in this composite is the dry pine-barren forest of Bayfield and Douglas counties in northwestern Wisconsin in 1989 (left) and 1995 (center). Vegetation appears green in these true-color images. A computer algorithm compared the 1989 and 1995 images and identified yellow areas in the right panel as having been harvested in the interim.
Photo: courtesy Mutlu Ozdogan
Using satellite images, Mutlu Ozdogan, an assistant professor of forest and wildlife ecology at the University of Wisconsin–Madison is automatically generating maps showing where trees have been harvested in the form of clear-cut areas over five-year intervals.
By many measures, Wisconsin has the largest forest-products industry in the country, and according to Forward Wisconsin, it is the biggest employer in 23 counties, with 72,000 employees, and 14 percent of manufacturing jobs.
Nonetheless, tracking what’s happening on the ground in terms of the location, shape, and size of the harvested plots has never been easy, says Ozdogan.
About 30 percent of Wisconsin forests are publicly owned, and maps have been available showing harvests on that land. However, most harvesting occurs on private lands, leading to a gap in our knowledge.
Wisconsin’s forest covers 16 million acres, says Ozdogan, “and it has vast economic, cultural, ecological and recreational benefits.” Large-scale harvesting, mainly of softwood for paper, is leading to fragmentation, and changes in forest composition and biodiversity, he says. “Wisconsin is the number one paper-making state in the nation, and cutting down forests affects these values in different ways, but the first step in understanding what is happening is to make a map.”
The maps start with images from NASA’s Landsat satellite, which views Earth in several different wavelengths of light.
To power photosynthesis, tree leaves absorb most of the sun’s visible red light, so removing trees greatly increases the visible red light reflection. Although areas with diseased, wind-thrown or burned trees can also increase reflectance, these phenomena can usually be distinguished from tree removal, Ozdogan says. “Most harvesting is bounded by straight lines, while fires, wind throws and disease outbreaks have irregular shapes, so most of the time, they are easily distinguished from harvests.”
To confirm accuracy, Ozdogan compared his maps to hand-drawn maps, based on the same Landsat images. “The human brain is the world’s best image processor,” Ozdogan says, “and I assume those hand-drawn maps are better than ours, but we correspond at least 90 percent of the time.”
Where the computer excels is in productivity. One pass of Landsat covers a square about 110 miles on a side, so only three passes can document the situation in Wisconsin’s northern forests and Michigan’s Upper Peninsula. Ozdogan is developing a series of maps showing changes at five-year intervals, from 1985 through 2010.
Once the technique is perfected, Ozdogan plans to extend it to the entire North American forests. “We have the computer resources to do this and once the algorithm is stabilized, we will move in that direction, mapping harvested areas, wall-to-wall for the entire country every few years, using free and open source tools.”
Ozdogan also envisions building a web platform at UW–Madison “where scientists, non-governmental organizations, policy makers and anyone else interested in this kind of data would be able to come and do the analysis themselves. They will be able to interpret results and draw their own conclusions from data that are free of subjectivity.”
Ozdogan adds that the computer-generated maps can be merged with other datasets related to water conservation, insect and disease outbreaks, fire, weather and climate.
The maps will also be useful for exploring how Wisconsin’s large deer herd, which is changing the forest as it finds suitable habitat in characteristic north-woods plants and trees. Tree removal creates “edge” habitat — a meeting of fields and forests — that deer prefer, and a better ability to analyze the locations of edge and deer should improve our understanding of their relationship, says Donald Waller, a UW–Madison professor of botany and expert on deer in Wisconsin forests.
“Seeing the extent of forests, openings and edges and their proximity to each other is important because deer and other wildlife species respond to edges and openings,” Waller says. “This work is valuable for showing us the true condition of our forests — at the landscape scale.”
-
Interwoven
How Indigenous knowledge and science can work together to communicate about climate.
-
UW–Madison’s reach throughout Wisconsin adds up to $38.9 billion a year
The university supports more than 287,000 jobs and helps drive private-sector growth.
-
‘Being part of something bigger than you’ with Badger Volunteers
UW–Madison students head into the local community to find purpose and make a difference.
-
UW–Madison’s Tech Exploration Lab: Where the classroom meets the real world
The lab is built around a simple expectation: Students come to build, test and refine projects with real problems in mind.