Captions
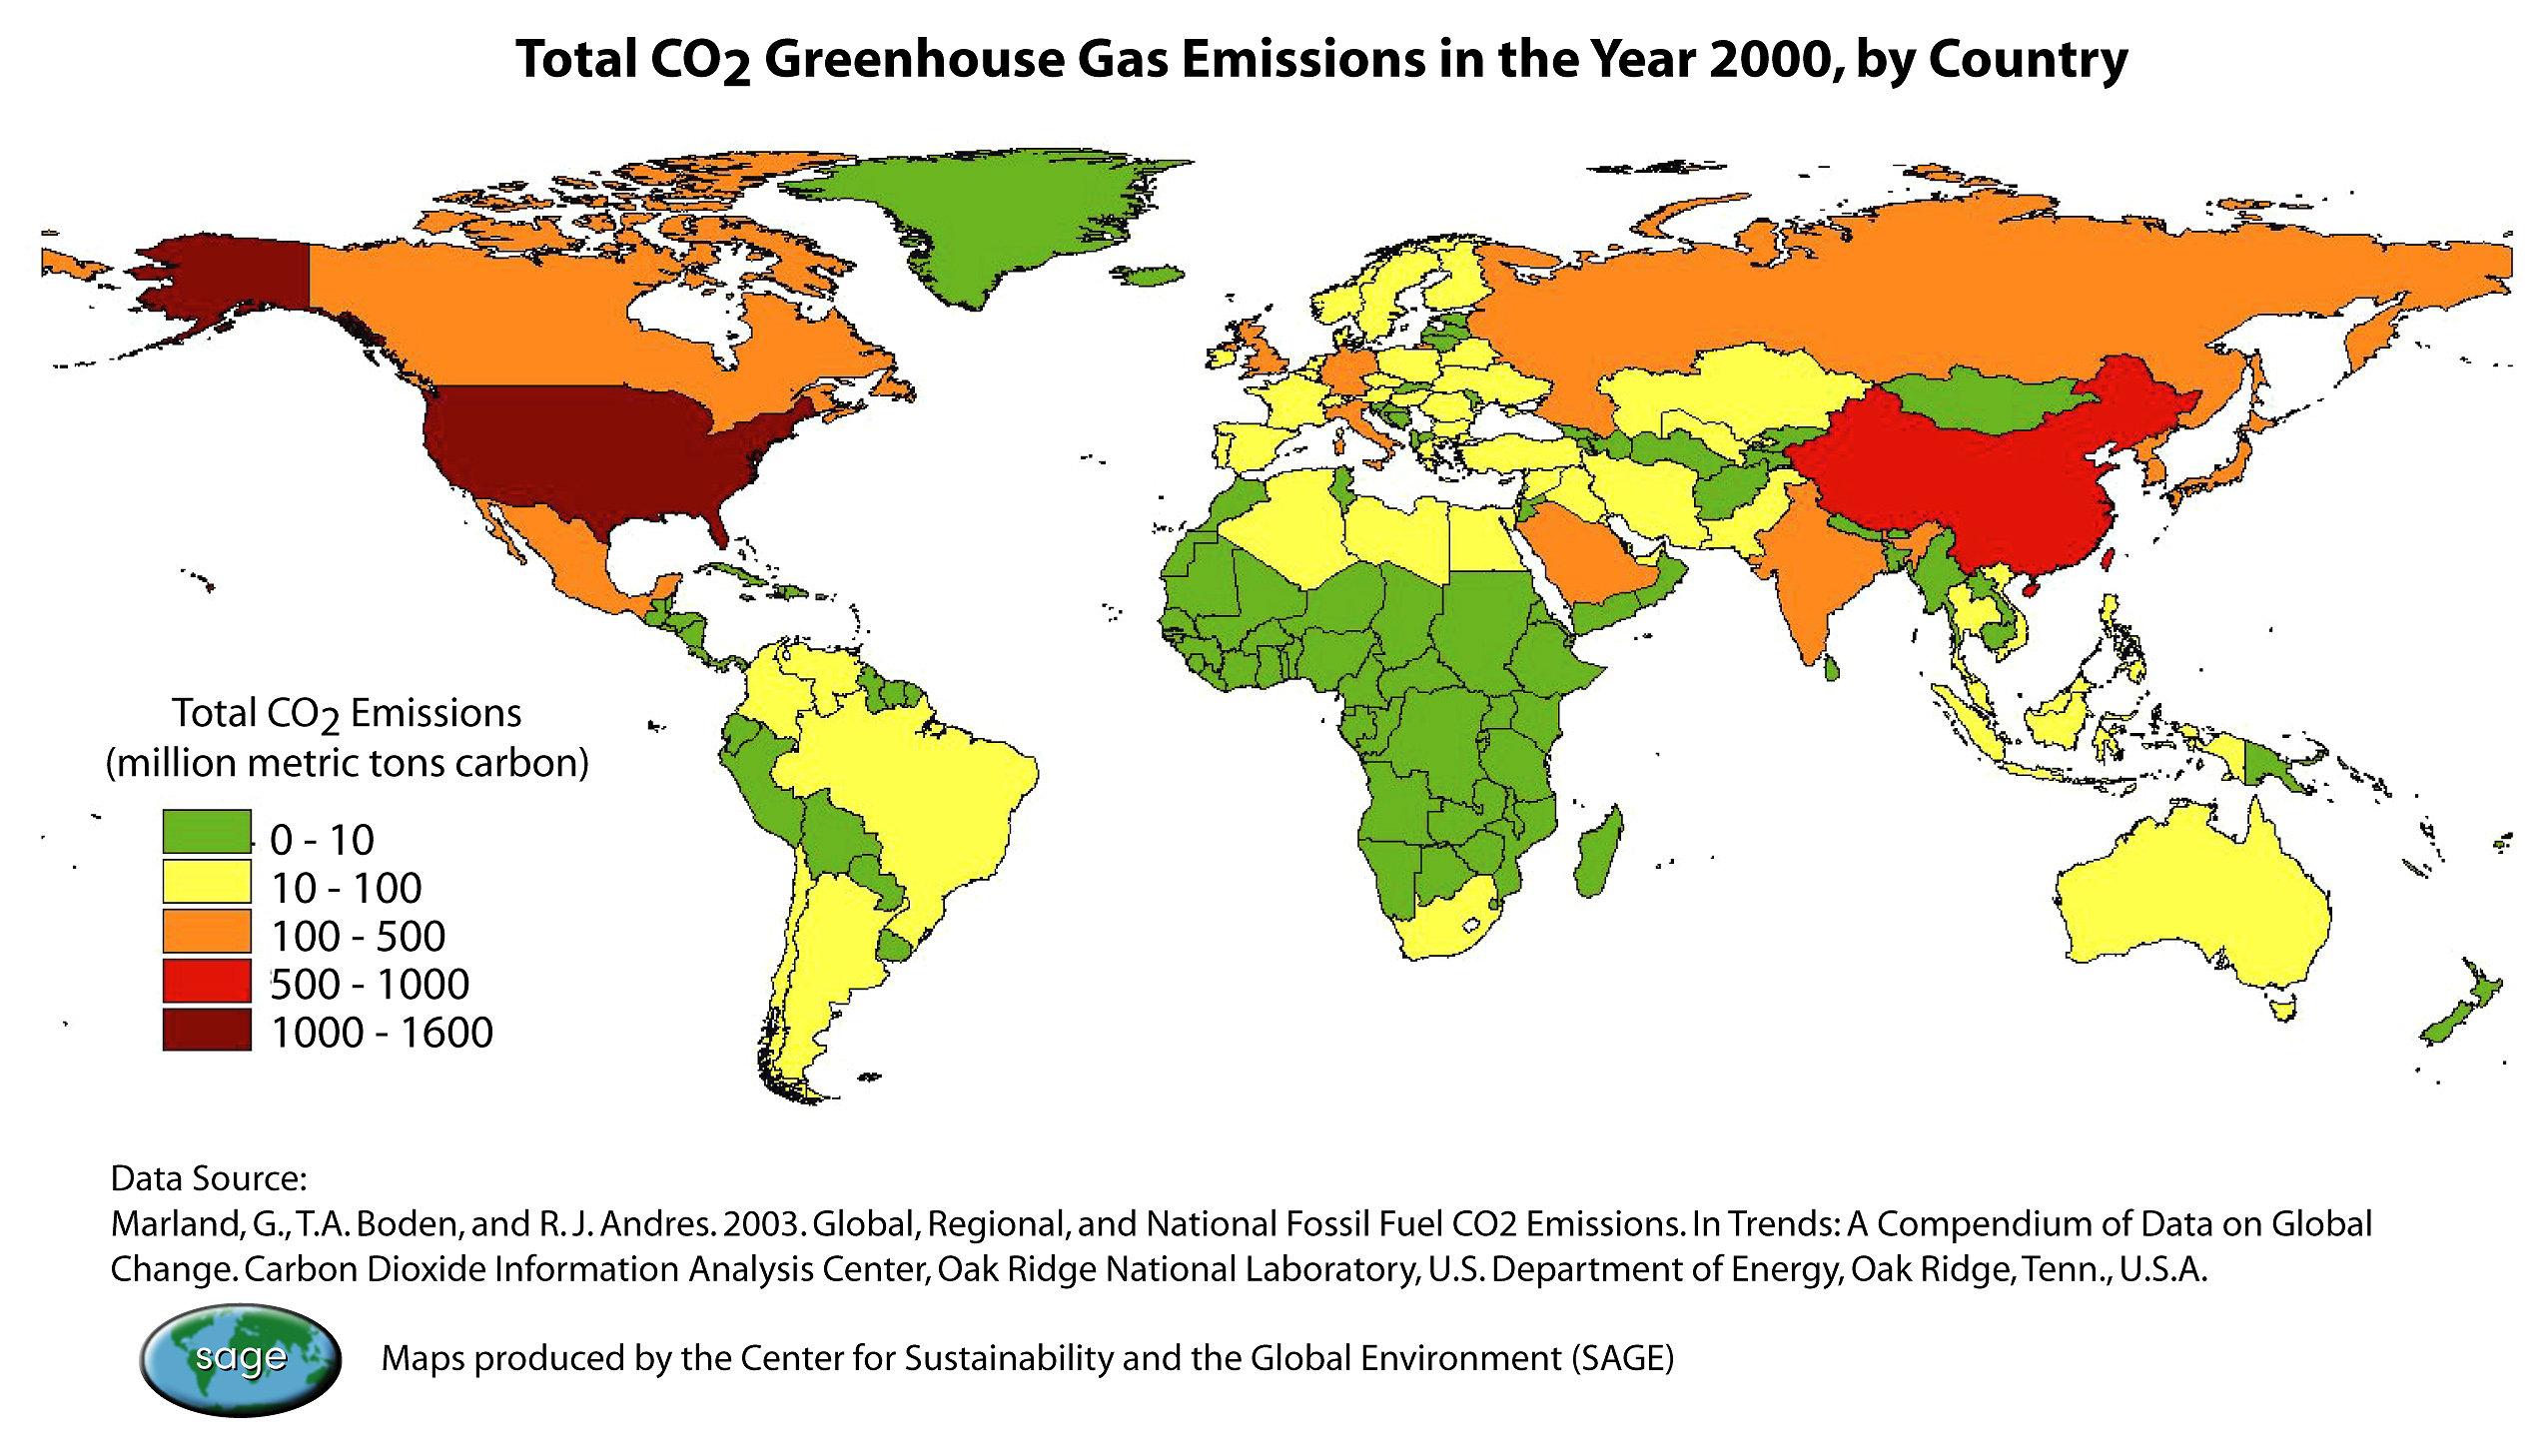
Left: This map shows total carbon dioxide emissions from fossil-fuel burning, cement production, and gas flaring for the world's countries in 2000. Emissions are expressed in million metric tons of carbon. The map was created by a team of climate and health scientists led by Jonathan Patz, associate professor of environmental studies and population health sciences at the University of Wisconsin-Madison.
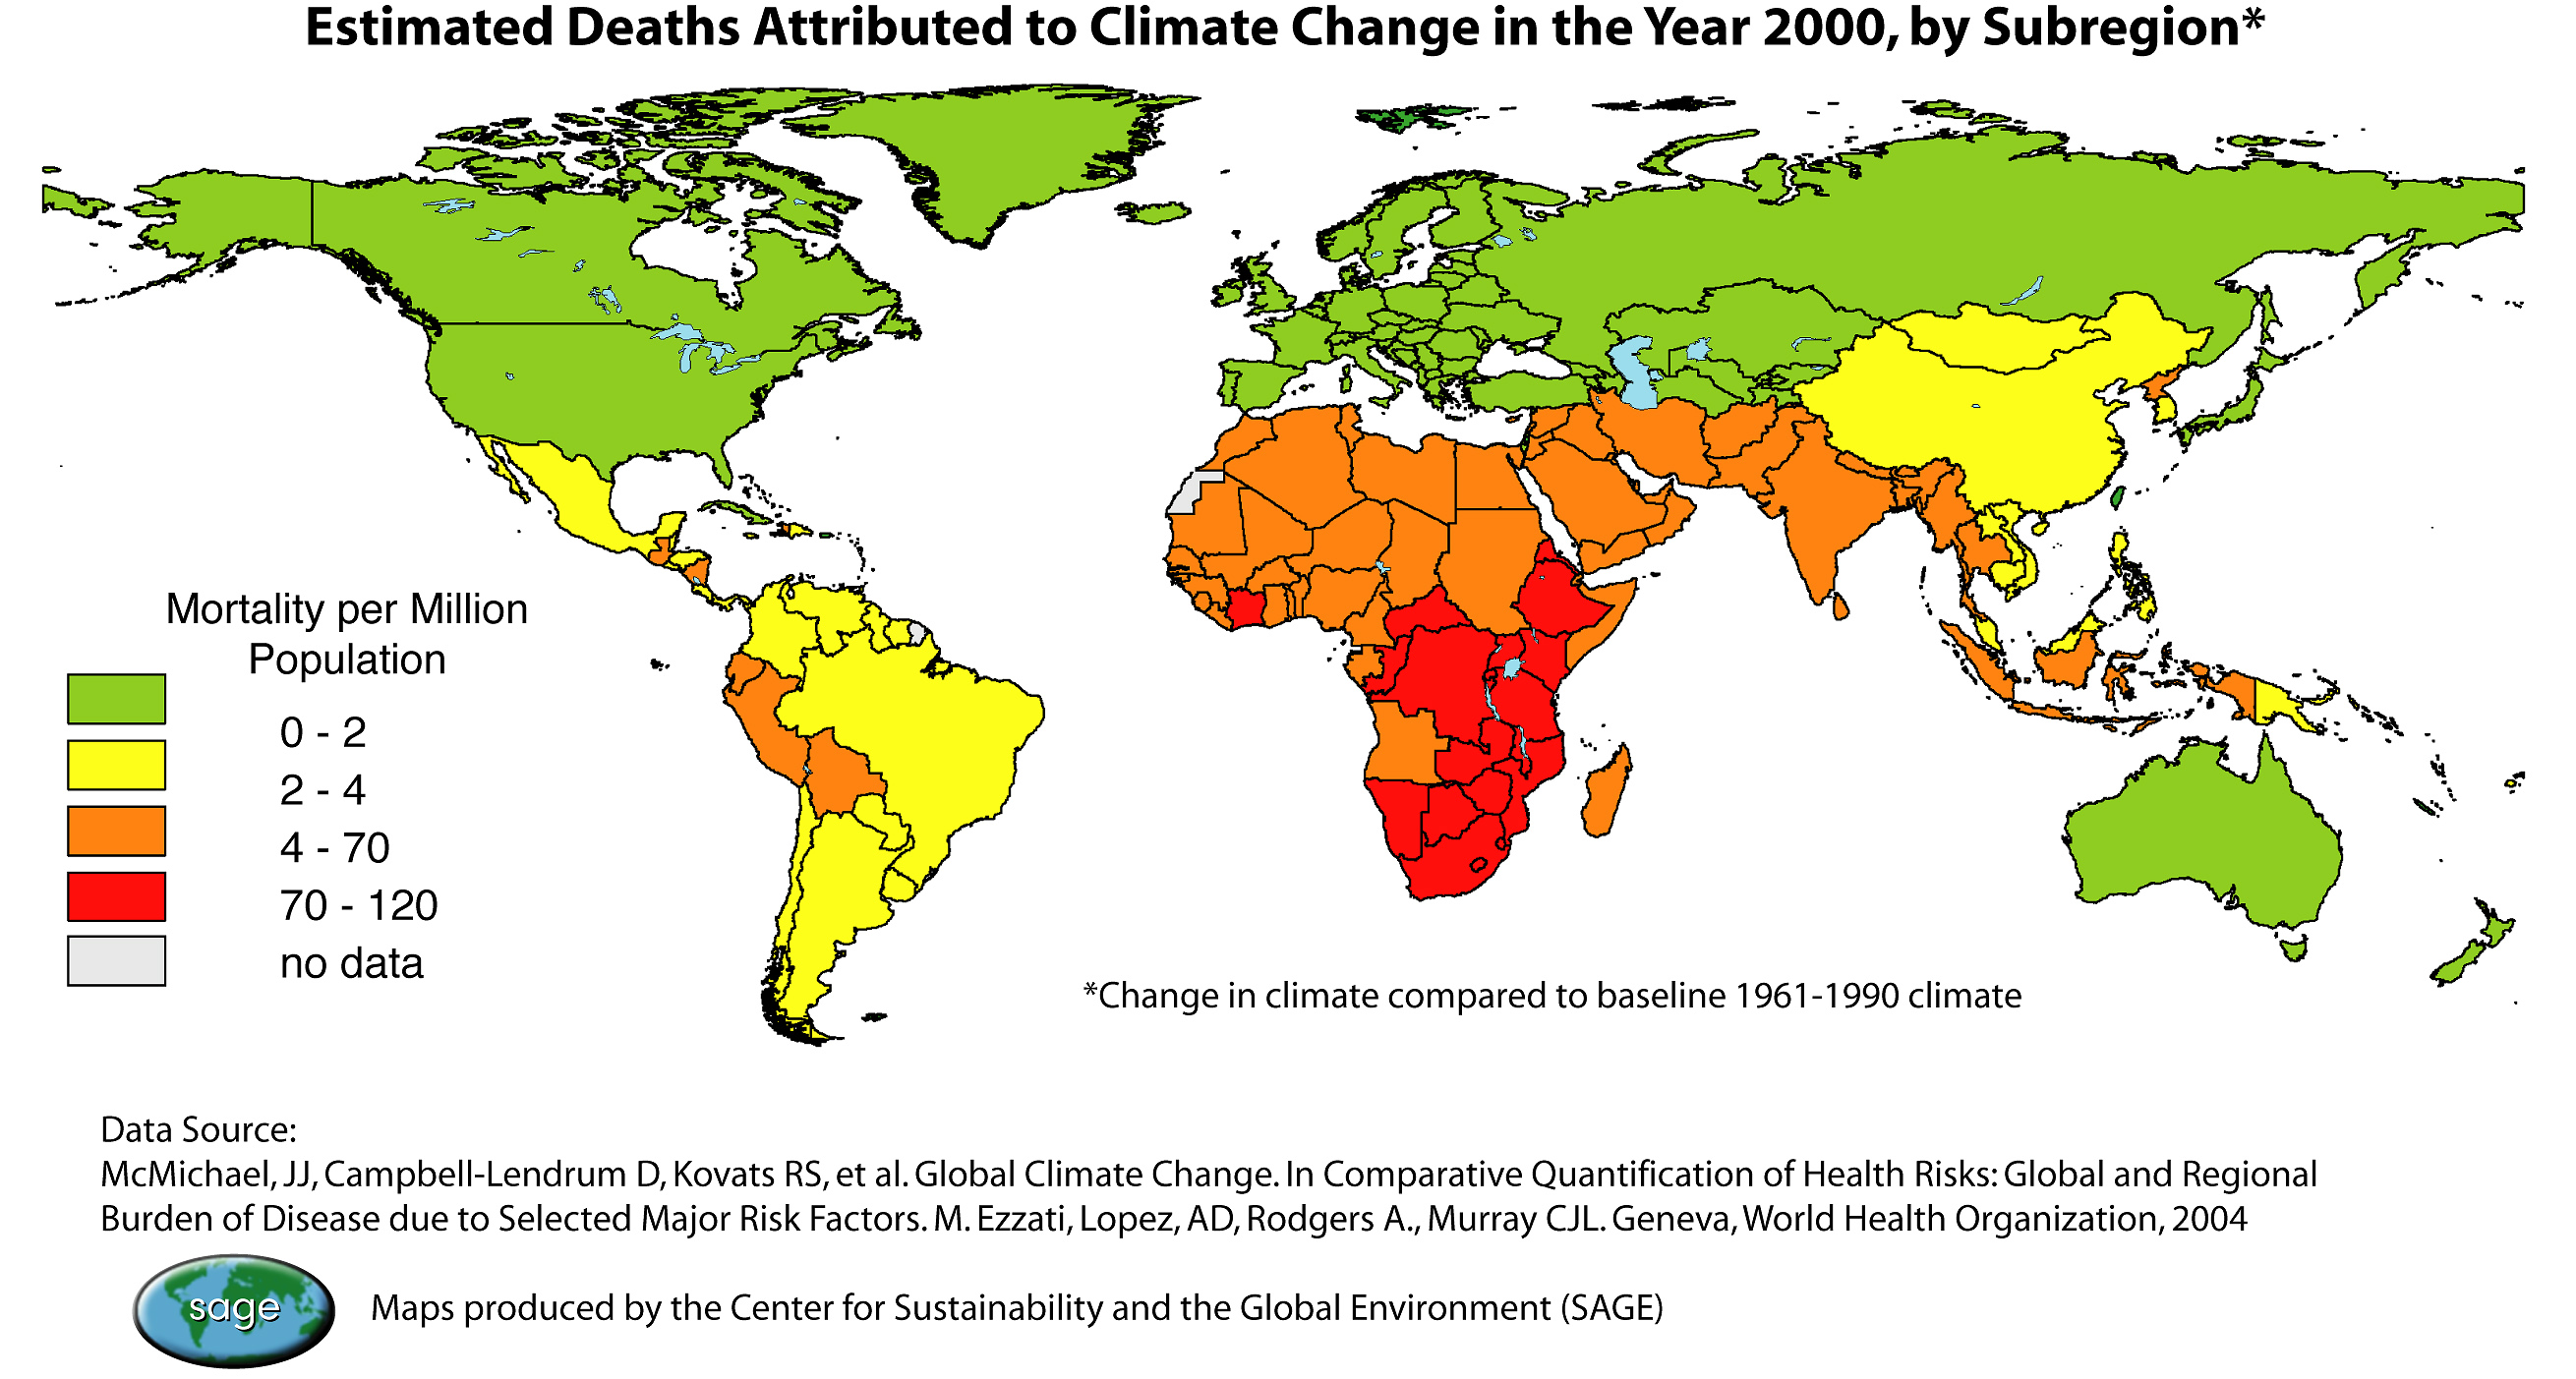
Right: The health effects of global warming vary markedly at the regional scale. This map shows the estimated numbers of deaths per million people that could be attributed to global climate change in the year 2000. Drawing from data from the World Health Organization, the map was created by a team of climate and health scientists led by Jonathan Patz, associate professor of environmental studies and population health sciences at the University of Wisconsin-Madison.
Photo by: Center for Sustainability and the Global Environment
Date: 2005
High-resolution 300 DPI JPEG (left map)
High-resolution 300 DPI JPEG (right map)
